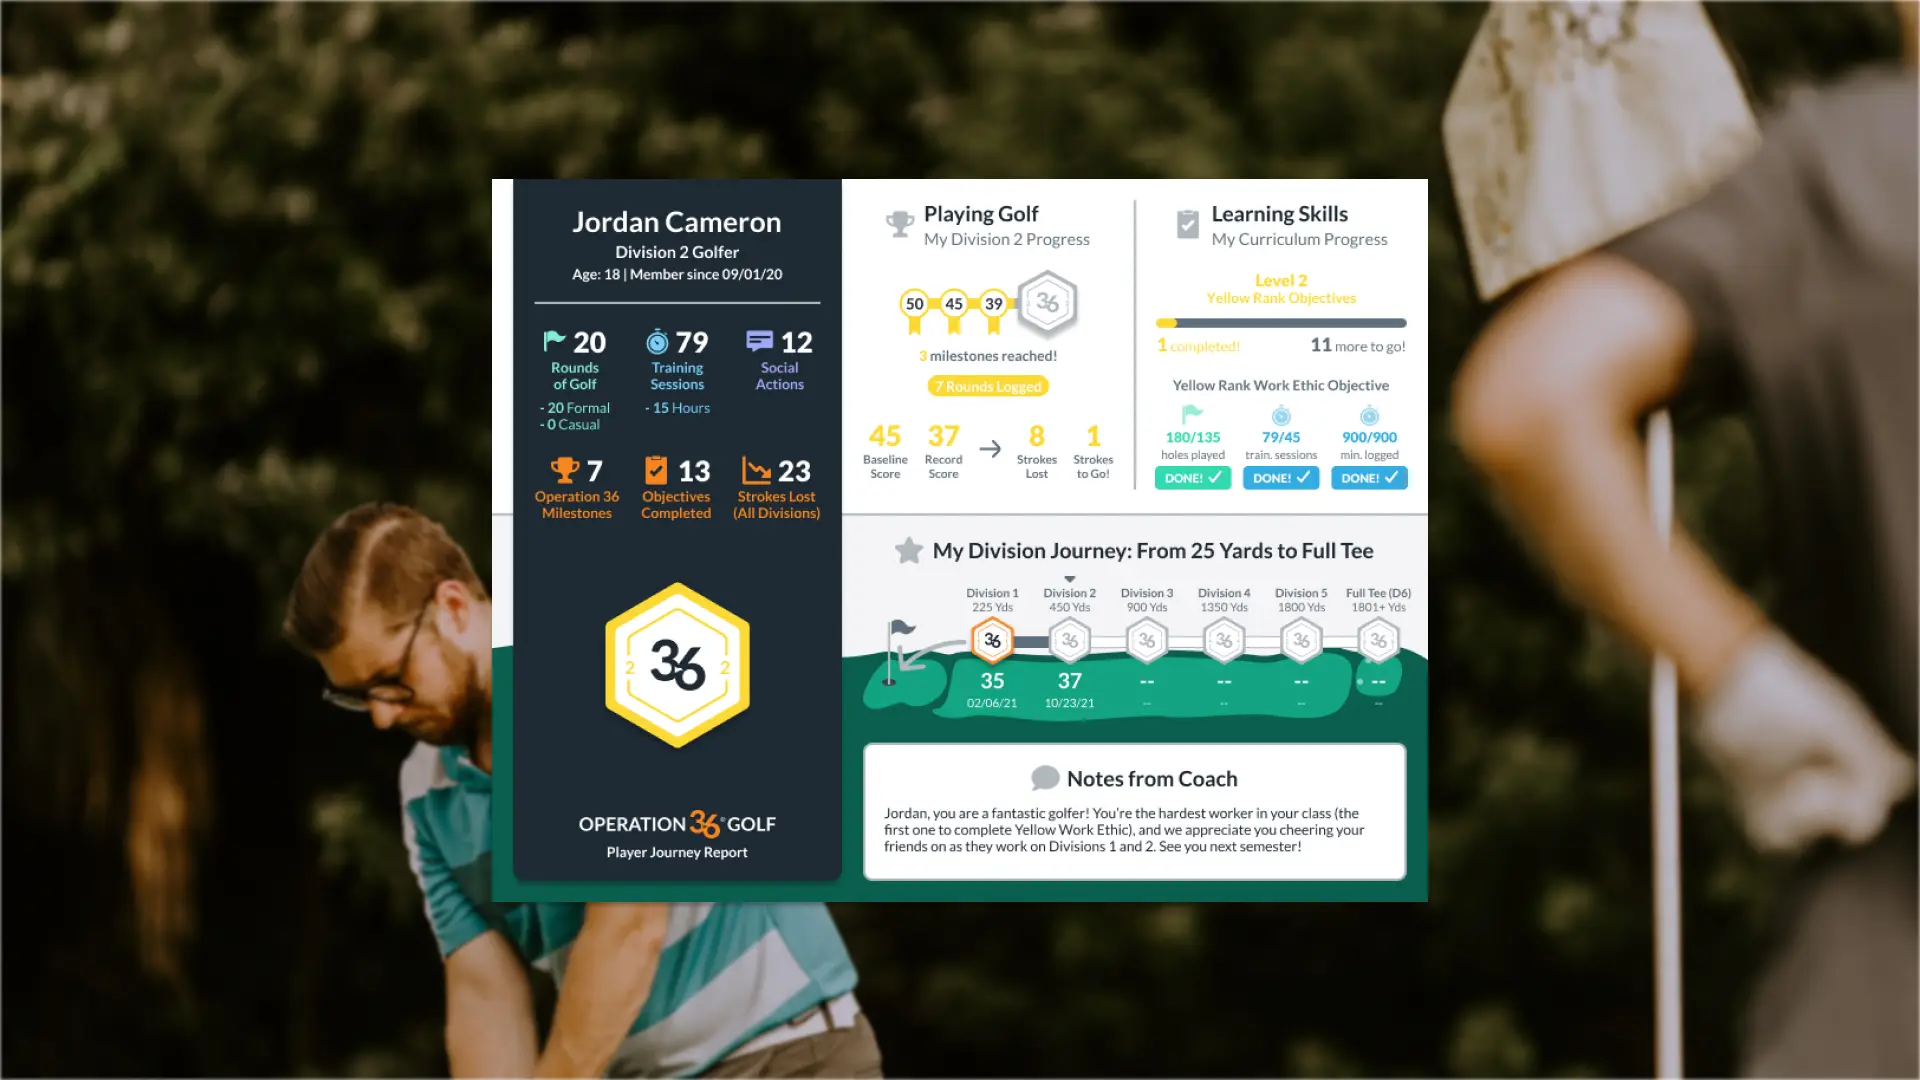
Player Journey Report
Reduced time spent on creating student reports by allowing coaches to automatically generate reports for entire classes.
Overview
Note: Some content has been redacted or omitted to comply with my NDA.
Operation 36 Golf (Op 36) made it easy for coaches to deliver golf programs and students to learn, play, and train. Both could see stats within the apps, but progression wasn't always obvious. This meant students became discouraged, and coaches spent long hours creating progress reports for each student.
The Player Journey report makes it easy for coaches to deliver end-of-semester reports that demonstrate a student's progress (and the effectiveness of their Op 36 program). Instead of going through pages of data for every student, extracting what they needed, and figuring out how to present it nicely, coaches can generate reports for multiple students with just a few clicks in the Op 36 web app. They can then mass print or email them to their students - saving time and their students.
By creating this Player Journey Report, Op 36 helps coaches motivate their students and parents to continue with the program. The report is also useful before or after the end of the semester. For example:
- Use the report at the beginning of the semester to show what you will cover and set goals.
- Use the report in the middle of the semester as a progress check-in.
- The report also serves as a physical momento of the program - and good times - for the student during the off-season.
Don't have time to read the process? Jump to Results for more final designs!
Process
Objectives

- Make it easier for the coach to create end-of-semester progress reports for their students and parents.
- Show students their progress in each part of the Op 36 program so they feel like they are improving, which will increase retention.
Research: Surveying coaches to verify our assumptions

Due to feature requests and coaches’ current methods for assembling reports, we knew that it wasn’t easy for coaches to present progress at end of the semester to students. We needed this report to complete the Op 36 lifecycle of playing, training, and learning.
I had an idea of what coaches would want, but I wanted to verify our assumptions. Thus, I asked a few of our coaches, “If you could generate a 1-page progress report for a student, what would you include?”

We limited the first version to 1 page because we wanted to:
- Have an MVP to test as soon as possible
- Know what was most important to our coaches
- Keep it easy for parents and students to digest
Ideation: Combining all of the feedback into one-page designs

From our coaches’ responses, I created a large list of desired items. Then, I designed a few iterations that included the most common responses - trying to squeeze as much as possible into one page - then shared it with our coaches for additional feedback.
Prototyping: From boring reports to fun awards
To our surprise, we learned that the report now had too much data! Sure, it was useful, but parents and students probably wouldn’t feel excited or want to read through all of those tiny numbers, which defeats its purpose. It didn’t look friendly.

One coach suggested that we design it to resemble an award as opposed to a page with rows and rows of numbers and icons (AKA a typical report). He shared his thoughts through a call with us, so we also got to learn more about his current process for generating reports.

That coach’s reasoning for the award concept made sense, and we knew that our printed certificates were popular products in our store, so I decided to design a few more variations with that in mind.

I reduced the amount of data displayed, made the numbers and icons bigger, and added a big badge. Each variation had slightly more data in certain sections than others.
From all of the research I had done so far, I felt like we were pretty close to an initial solution.
I sent out an email poll so we could quickly reach out to all of our coaches, get their vote for their favorite design, and see if there were any other critical pieces missing.
A few days after sending the poll, we reviewed the results. There were a few pieces of feedback, but I figured we could incorporate those in a later iteration - they didn’t sound like dealbreakers. Thus, we proceeded with the most popular design.

Finally, I had to design the flow for selecting the students and generating the reports in our web app. Using what we had learned from both historic and recent research, I included the ability to:
- Select multiple students at one time
- Apply a generic note to all students if desired
-
Export the reports as one file for easy printing
- In the future, we also want the ability to export them separately for easier emailing
Development: Mostly seamless, but needed some refactoring

As usual, I prepared the project for handoff to our developer with tasks, specs, endpoint response data to use, and test cases (including edge cases).
However, after the developer was done, I later refactored the code for the report itself to improve the structure, styling, and readability.
Marketing + Release: Drip campaign throughout the semester

Prior to release, I also worked on a drip campaign with my teammate. After deciding on the timing, messaging, and graphics, we launched the new report, then continued to remind our coaches about its existence and utility over time through our emails.
We planned the emails based off of the time of the semester. For example, during the middle of the semester, we promoted it as a mid-semester progress report, whereas near the end, we pitched it as a great way for your students to remember you and your program after the last day of classes.
Results: Excited coaches and enthusiastic feedback

After releasing, we got a lot of emails where coaches told us they were excited to use the report, showed us how they were using the report, and/or shared ideas for potential improvements, so we knew our coaches were using it. It sounds like it was a success.
We knew our coaches are happy with it, but we still had to measure our retention over time to see if the report helped us meet the business objective of improved retention.


Reflection: Talk to students and coaches that don't use reports
Judging from the feedback, the Player Journey Report was one of our more successful features. However, it could have been even better if we were able to get more feedback from other types of users, such as the recipients of the reports (students and parents) and coaches that don’t normally use our reporting features.
We also ran into a lot of technical issues along the way, so we didn’t have time to set up a good tracking mechanism to uncover usage patterns.
- Address technical debt ASAP. Our outdated React version meant that we were stuck with a library that didn’t allow us to include the student’s profile photo, which would make the reports easier to distinguish from one another and personalize them for the students.
- Talk to coaches that don’t use reports at all and learn why.
- Get feedback from actual parents and students.
- Get feedback on the report generation flow.
- Start thinking about what data to track earlier on in the project so we have more time to incorporate tracking.